In the professional services sector, a robust top line often conceals a fragile bottom line. While your revenue may be climbing, you might find that your net profit remains stubbornly low or that your team is perpetually busy without hitting their strategic targets. Mastering the right key performance indicators for service businesses is not simply an administrative exercise; it’s the bridge between technical expertise and commercial scalability. We understand the frustration of managing a high-performance firm where cash flow feels unpredictable and capacity remains a constant guessing game.
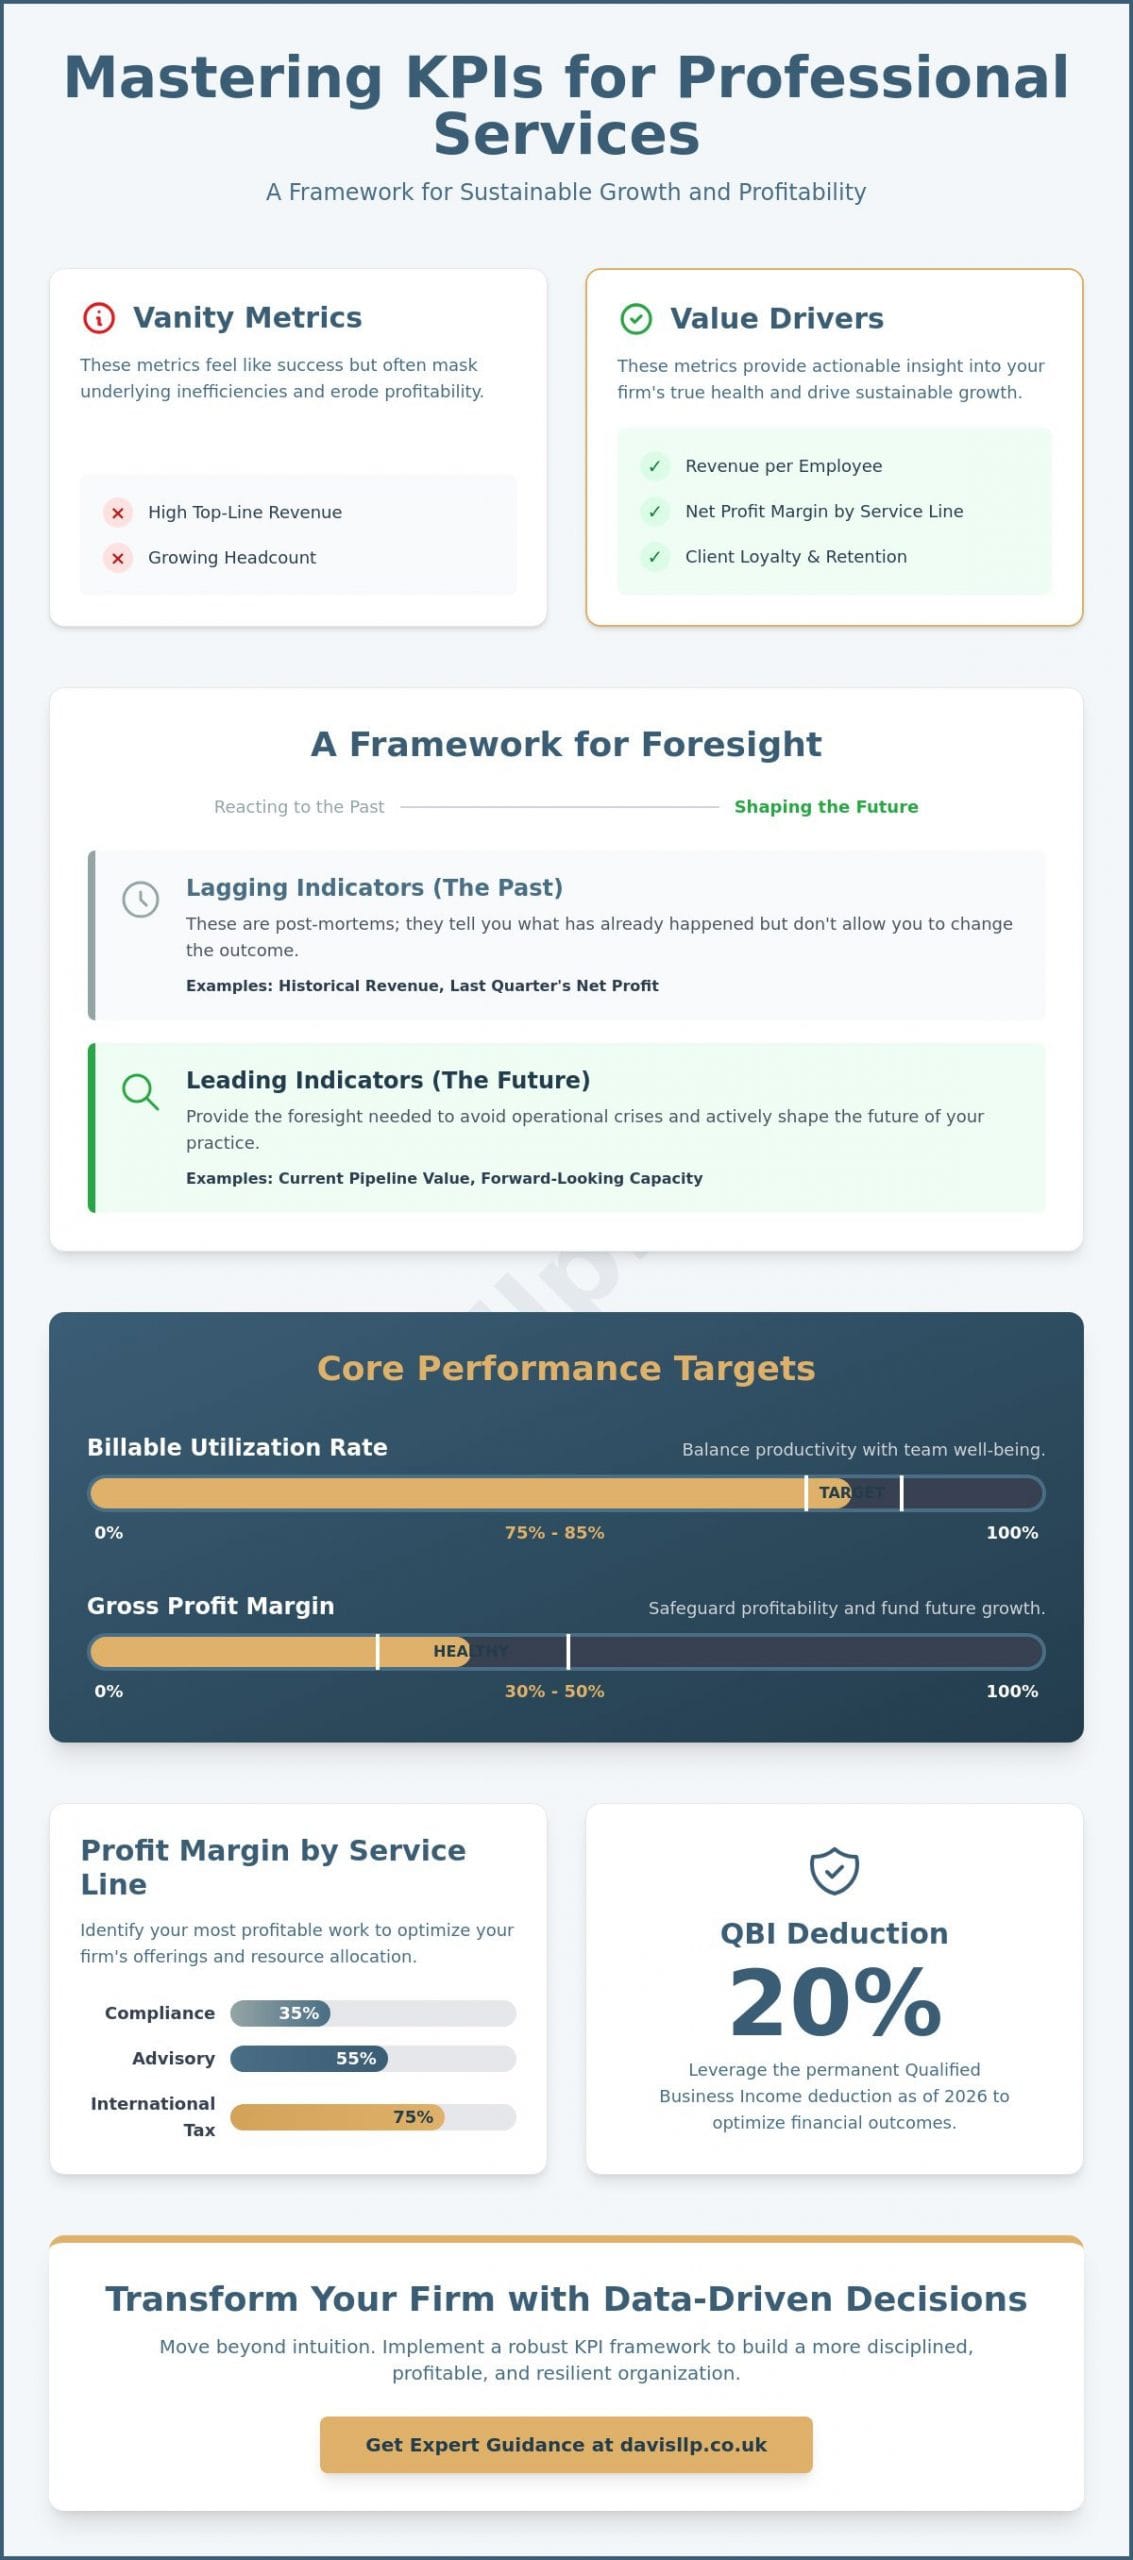
We’ve designed this guide to help you move beyond surface-level metrics and implement a framework that drives sustainable growth. You’ll learn how to target utilization rates of 75% to 85% and maintain healthy gross margins between 30% and 50% without compromising the well-being of your staff. We’ll examine how to align your daily operations with the economic realities of 2026, including the permanent 20% QBI deduction and current interest rate trends. By the end of this article, you’ll have the clarity needed to transform your firm into a more disciplined, profitable, and resilient organization.
Key Takeaways
- Differentiate between vanity metrics and genuine value drivers to ensure your financial health reflects true operational efficiency.
- Master the balance of billable utilization to protect your firm’s intellectual capital while maintaining high-calibre output.
- Establish a refined framework of key performance indicators for service businesses that aligns your immediate actions with long-term commercial objectives.
- Analyze the hidden costs of project overruns and scope creep to safeguard your margins and improve resource allocation.
- Quantify client loyalty and retention trends to build a more predictable and sustainable revenue model for the future.
The Strategic Significance of KPIs in the Professional Services Sector
In the professional services sector, value isn’t derived from physical inventory or heavy machinery. It’s built upon the collective expertise, reputation, and time of your team. Consequently, key performance indicators for service businesses must serve as a sophisticated reflection of how effectively that intellectual capital is being deployed. A Performance Indicator is not merely a number on a spreadsheet; it’s a strategic signal that tells us whether our operational reality matches our long-term vision. Without these markers, leadership teams often find themselves steering their firms based on intuition rather than empirical evidence.
Many firms fall into the trap of monitoring “vanity metrics” that offer a false sense of security. High top-line revenue or a growing headcount can feel like success, yet these figures often mask underlying inefficiencies that erode profitability. By 2026, the distinction between these surface-level numbers and true “value drivers” has become sharper. A value driver, such as revenue per employee or net profit margin by service line, provides actionable insight into the firm’s actual health. Tracking too many irrelevant data points leads to data fatigue. This obscures the “vital few” metrics that actually influence your bottom line and support a culture of quiet excellence.
Leading vs. Lagging Indicators: A Framework for Foresight
Understanding the difference between leading and lagging indicators is essential for proactive management. Lagging indicators, like historical revenue or last quarter’s net profit, are post-mortems. They tell us what happened, but they don’t offer the opportunity to change the outcome. While they’re necessary for compliance and reporting, they shouldn’t be the sole basis for your forward-looking strategy. They’re the results of decisions made months ago.
Leading indicators provide the foresight needed to avoid operational crises before they occur. We focus on metrics like current pipeline value and forward-looking capacity. If your billable utilization targets are set between 75% and 85%, but your pipeline shows a significant dip in the coming quarter, you have the lead time to adjust your business growth acceleration strategies. Balancing both types of indicators ensures you’re not just reacting to the past, but actively shaping the future of the practice. It allows for a more measured and deliberate approach to scaling.
Aligning Metrics with Partnership Goals
In a high-trust environment like a professional practice, KPIs should foster a culture of accountability rather than one of surveillance. This requires a shift from measuring individual output in a vacuum to focusing on collective strategic success. When metrics are transparent and aligned with the partnership’s core values, they reinforce a sense of shared purpose. We believe that data should empower your team, providing them with the clarity to understand how their daily efforts contribute to the firm’s stability and growth. This alignment turns a simple measurement tool into a powerful engine for organizational cohesion and long-term reliability.
Financial Health KPIs: Optimising Profitability and Cash Flow
Financial health in a professional practice is often more complex than it appears on a standard balance sheet. While revenue is a necessary metric, it doesn’t account for the efficiency of your most expensive asset: your people. Revenue per employee acts as the ultimate measure of firm-wide efficiency. It cuts through the noise of headcount growth to reveal if your scalability is genuine. If you’re adding staff but this figure remains stagnant, your operational complexity is likely outpacing your commercial gains. It’s a vital metric among key performance indicators for service businesses because it forces a focus on high-value output rather than just volume.
We also encourage a deep analysis of net profit margin by service line. It’s common for specialized work, such as international tax planning, to yield higher margins than routine compliance tasks. Without this granularity, you risk your most profitable areas silently subsidizing inefficient ones. Managing these nuances requires precision. Regularly reviewed management accounts provide the granular visibility needed to identify these trends and make adjustments before they impact your annual results. This level of oversight is essential for maintaining a steady trajectory of growth.
Cash flow remains the lifeblood of any practice, yet it’s often trapped in “lock-up.” This represents the combined value of work-in-progress (WIP) and debtors. In the professional services sector, a high lock-up figure suggests that while you’re technically busy, your capital is stagnant. Implementing rigorous cash flow management strategies ensures that the value you create is realized in your bank account, providing the liquidity needed for reinvestment and partner distributions.
Realisation Rate: The Truth Behind the Billable Hour
Realisation is the ultimate arbiter of project value. It measures the difference between the time recorded at standard rates and the amount actually billed and collected. You might achieve a high utilization rate, but if poor project scoping leads to significant write-offs, the firm suffers a financial loss. Reviewing KPI Examples for Service Industry benchmarks shows that top-performing firms prioritize realization over raw hours. Improving this metric often requires a more disciplined approach to initial project definitions and tighter control over scope creep.
Client Lifetime Value (CLV) and Acquisition Costs
Understanding the long-term worth of your clients allows for more strategic decision-making regarding marketing spend. Client Lifetime Value is the total net profit a firm expects to earn from a client over the duration of the relationship. When you compare this to your acquisition costs, you can determine the true ROI of your business development efforts. For firms offering recurring services like trust tax services or payroll, a high CLV provides a predictable foundation that justifies the initial investment in client onboarding and relationship management.
Operational Excellence: Measuring Resource Utilisation and Quality
Operational excellence is the invisible foundation of a profitable firm. While financial metrics reveal the outcome of your efforts, operational key performance indicators for service businesses explain the “why” behind those numbers. High billable utilisation is often cited as the primary goal, yet there’s a delicate “sweet spot” to maintain. Pushing a team beyond 85% utilisation might yield short-term gains, but it frequently leads to burnout and a decline in work quality. We focus on finding a sustainable rhythm that balances high productivity with the mental clarity required for complex advisory work. It’s about consistency rather than exhaustion.
Project overrun rates serve as a critical warning sign for scope creep. When a project exceeds its estimated hours, the firm essentially pays for the privilege of working. Tracking these hidden costs allows for more precise future scoping and better client management. We’ve observed that employee retention and satisfaction aren’t just HR concerns; they’re vital indicators of long-term stability. There’s a direct correlation between staff longevity and the depth of client trust. Similarly, the efficiency of your internal processes, such as payroll services and administrative overhead, directly impacts your net margins. Streamlining these functions ensures that your fee-earners can concentrate on high-value delivery.
Capacity Planning and Forecasted Utilisation
Effective leadership requires looking through the windscreen rather than the rearview mirror. By using data to forecast utilisation, you can predict exactly when to hire before service quality begins to erode. Over-utilisation is a silent firm-killer. It compromises the thoroughness that clients expect from a high-calibre practice. We recommend refining workflows to reduce non-billable administrative burdens, allowing for a more focused application of expertise. This proactive approach to resource management is a hallmark of Professional Services KPIs used by industry leaders to maintain a composed and reliable service delivery model.
Quality Assurance and Compliance Metrics
Technical excellence is non-negotiable in the professional services sector. Error rates in compliance filings aren’t just administrative hurdles; they’re direct measurements of your firm’s technical health. The cost of rework is a significant drain on resources that often goes unmeasured. By integrating rigorous audit and assurance standards into your daily operational KPIs, you create a self-correcting culture of precision. This ensures that efficiency never comes at the expense of the reliability your reputation is built upon. It’s this commitment to quiet excellence that distinguishes a strategic partner from a mere service provider.
Client Satisfaction and Retention: The Drivers of Sustainable Growth
Sustainable growth in a professional practice is rarely the result of aggressive new business acquisition. It’s the byproduct of deep, enduring relationships. When evaluating key performance indicators for service businesses, metrics like the Net Promoter Score (NPS) are frequently prioritized. While NPS provides a useful baseline, it often lacks the nuance required for complex, high-touch engagements. We find that qualitative client feedback offers a far more accurate reflection of a firm’s standing. Understanding the sentiment behind the score allows us to refine our approach and address subtle shifts in client expectations before they manifest as dissatisfaction.
Client churn rate is a sobering but essential metric. Analysing why a high-value client departs often reveals gaps in the “composed partnership” rather than issues with technical delivery. Conversely, your referral rate remains the most authentic indicator of professional reputation. A client who risks their own credibility by recommending your services has provided the ultimate validation of your expertise. For specialized areas like international tax planning, success is measured through tangible client outcomes, such as tax efficiency and regulatory compliance, which naturally foster these high-value referrals.
The “Trusted Advisor” Metric: Depth of Service
Depth of service is a powerful indicator of a firm’s status as a trusted advisor. We track the number of services used per client, often referred to as cross-service penetration. Clients who engage with multiple areas, such as personal tax services and trust tax services, demonstrate higher retention and significantly lower price sensitivity. This depth creates a defensive moat around the relationship. It also provides a foundation for Business Growth Acceleration, as it allows us to identify strategic opportunities for the client that a single-service provider would likely overlook. This internal growth is often more profitable and stable than external acquisition.
Response Time and Communication Efficacy
Communication efficacy is frequently overlooked in operational audits, yet it’s central to the client experience. We measure response times to ensure that the sense of partnership remains secure and reliable. Timely communication correlates directly with perceived value. If a client feels ignored, the technical quality of the work becomes secondary. However, this accessibility must be balanced with the necessity for deep, focused analytical work. A firm that prioritizes immediate replies over thorough analysis risks its reputation for technical excellence. Achieving this balance is a hallmark of a mature, well-managed practice that values both responsiveness and rigour.
Implementing a KPI Framework with Professional Gravitas
Implementing a framework for key performance indicators for service businesses requires a transition from passive observation to active governance. It’s a deliberate process designed to instill order and intellectual rigour within your practice. We follow a four-step approach to ensure your data translates into meaningful change. Step 1 involves selecting the “Vital Few” metrics. Data fatigue is a genuine risk for busy partners; focusing on three to five indicators that directly impact your net profit and operational stability is more effective than tracking dozens of irrelevant figures. Step 2 is establishing a baseline. If your firm currently mirrors the industry average utilization of 68.9%, setting a target within the healthy range of 75% to 85% provides a clear, rigorous objective for the coming year.
Step 3 requires integrating these metrics into your monthly management reporting. Data is only valuable if it informs decision-making in real-time rather than as a year-end post-mortem. Finally, Step 4 is the continuous review and refinement of the framework. As your firm scales or shifts focus, perhaps towards more specialized dental tax specialist work or international engagements, your metrics must evolve to remain relevant. We act as a strategic partner in this journey, providing the professional distance and expertise needed to interpret these signals accurately and adjust your course with confidence.
The Role of Management Accounting in KPI Integrity
While automated dashboards offer convenience, they require professional oversight to maintain accuracy. Raw data can be deceptive if it isn’t reconciled against the practical realities of your bank balance and tax obligations. Ensuring your financial KPIs align with HMRC compliance is essential to avoid unforeseen liabilities that could erode your reported gains. We transform raw data into actionable business intelligence, ensuring your reported success is always grounded in financial truth and regulatory precision.
Next Steps: From Measurement to Growth Acceleration
KPI insights provide the empirical evidence needed to justify strategic investments. Whether you’re considering expanding your payroll services or investing in new technology, the data tells you when the timing is right. This maturity in management allows you to transition from managing people and tasks to managing systems and outcomes. It’s the hallmark of a firm ready for genuine Business Growth Acceleration. We invite you to discuss how a customized management accounting solution can provide the clarity your firm needs to thrive. Let’s work together to turn your operational data into a roadmap for sustainable, quiet excellence.
Securing the Commercial Future of Your Practice
The transition from monitoring basic revenue to mastering sophisticated key performance indicators for service businesses is what separates a reactive firm from a market leader. We’ve explored how identifying true value drivers, such as realization rates and client lifetime value, provides the clarity needed to scale without sacrificing technical excellence. By balancing billable utilization with long-term staff stability, you protect the intellectual capital that defines your reputation and ensures a steady operational rhythm. This disciplined approach to data ensures that your firm remains resilient even in volatile economic environments.
As Chartered Certified Accountants since 1901, we’ve spent over a century refining our approach to firm health. We specialize in business growth acceleration and management accounting, offering tailored advisory for both UK and international firms. We invite you to discover how our Management Accounting services can accelerate your business growth and provide the strategic oversight your practice deserves. Taking the first step toward a data-driven culture is a commitment to the enduring success and quiet excellence of your partnership.
Frequently Asked Questions
How many KPIs should a small service business track?
A small service business should typically focus on three to five “vital few” indicators. While modern software allows you to monitor dozens of data points, doing so often leads to data fatigue and obscures the metrics that truly drive profitability. By selecting a concentrated set of targets, you ensure that your leadership team remains focused on the firm’s most critical strategic objectives.
What is the difference between a metric and a KPI?
A metric is a general quantitative measurement of business activity, while a KPI is a specific target that measures progress toward a strategic goal. For instance, the number of new leads is a metric; however, the conversion rate of those leads into high-value international tax planning clients is a KPI. KPIs are the essential signals that tell you if your firm is actually healthy.
How do I measure the performance of staff who do not have billable hours?
You should measure non-billable staff through outcome-based metrics and internal service level agreements. For support roles, this might involve tracking the accuracy of bookkeeping services or the turnaround time for VAT compliance filings. These indicators ensure that every team member contributes to the firm’s operational excellence, even if their contribution isn’t recorded as a billable hour.
Is Net Promoter Score (NPS) actually useful for professional firms?
NPS serves as a helpful baseline for client sentiment, but it’s often too shallow for complex, high-touch professional engagements. We recommend supplementing NPS with qualitative feedback sessions to capture the nuance of the “trusted advisor” relationship. This approach provides a more comprehensive view of client loyalty than a single numerical score can offer on its own.
How often should we review our business KPIs?
We recommend reviewing your operational key performance indicators for service businesses on a monthly basis to maintain tactical control. Strategic reviews, which evaluate whether your chosen metrics still align with your long-term vision, should occur quarterly. This steady rhythm helps you identify trends early without creating a culture of reactive or hurried decision-making.
Can KPIs help with cash flow management in a service business?
KPIs are essential for effective cash flow management because they highlight where capital is being trapped. By monitoring “lock-up”—the sum of work-in-progress and debtors—you can see exactly how much cash is tied up in unbilled or unpaid work. Reducing these figures through disciplined tracking directly improves the firm’s liquidity and financial stability.
What is a good realisation rate for a professional services firm?
A healthy realisation rate for a professional practice typically ranges between 85% and 95%. This target ensures that the vast majority of time recorded at standard rates is actually billed and collected from the client. If your realisation consistently falls below this range, it’s often a sign of poor project scoping or significant inefficiencies that require professional oversight.
How do we implement KPIs without hurting employee morale?
Implementation is most successful when you frame KPIs as tools for collective success rather than individual surveillance. Transparency is key; when your team understands how hitting utilization targets protects the firm’s stability and prevents burnout, they’re more likely to embrace the data. It’s about fostering a culture of quiet excellence where everyone understands their impact on the firm’s growth.